In today’s data-driven world, presenting information in a clear and engaging manner is crucial. Effective visualizing data can significantly impact you whether you’re a marketer, educator, journalist, or business professional. Enter Infogram.com – a powerful tool designed to help you transform data into stunning visual content.
What is Infogram?
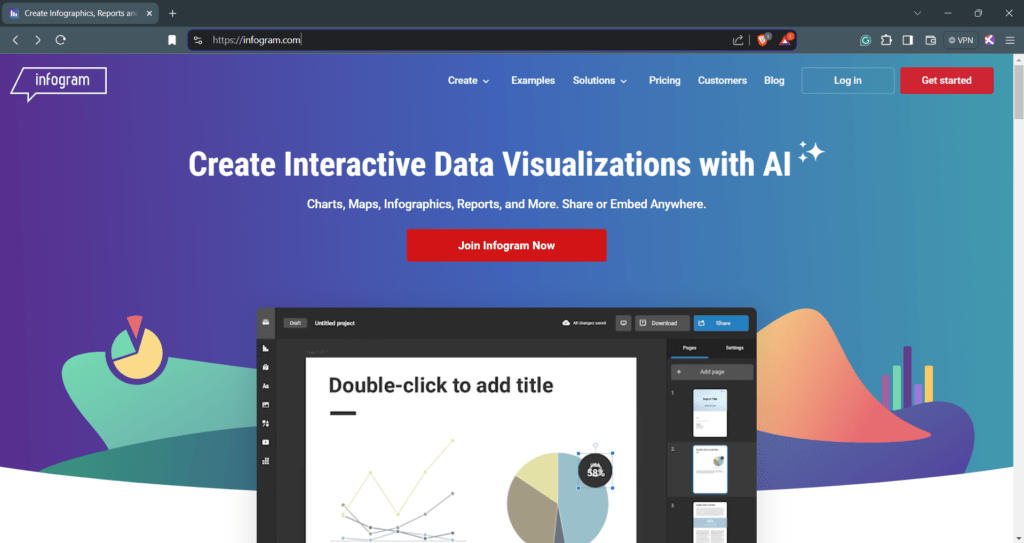
Infogram is an innovative web-based data visualization tool that allows users to create interactive charts, graphs, maps, and infographics with ease. Launched to make data visualization accessible to everyone, Infogram has grown to become a favorite among professionals who need to convey complex information simply and effectively. Since its inception, Infogram has empowered users worldwide to create over 10 million infographics, charts, and maps, showcasing its widespread adoption and reliability.

Why Use Infogram?
Infogram stands out in the crowded field of data visualization tools for several reasons. Its user-friendly interface makes it accessible to beginners, while its robust features cater to advanced users. Unlike many other tools, Infogram supports real-time collaboration, making it perfect for teams. Moreover, the ease of sharing and embedding visual content across various platforms sets it apart.
User-Friendly Interface: Infogram’s drag-and-drop editor allows users to create stunning visual content without any design or programming skills. The intuitive interface ensures that even beginners can start creating professional-quality infographics within minutes.
Real-Time Collaboration: One of Infogram’s standout features is its real-time collaboration capability. Teams can work together on the same project, making it easy to share ideas, make edits, and finalize designs without the back-and-forth of emails.
Wide Range of Templates: Infogram offers a plethora of templates and customization options, allowing you to create visually appealing and interactive charts, graphs, and maps. From business reports to educational materials, there’s a template for every need.
Key Features of Infogram
Interactive Charts and Graphs: Infogram allows users to create a wide variety of interactive charts and graphs. Whether you need bar charts, pie charts, line graphs, or maps, Infogram has got you covered. The interactivity feature makes data exploration more engaging for your audience.
Data Import Options: You can import data from various sources like CSV files, Excel spreadsheets, and Google Sheets, ensuring flexibility in how you handle data. This feature streamlines the process of data integration and visualization.
Customization and Design: With Infogram, you can customize every aspect of your visual content. Change colors, fonts, and layouts to match your brand or project requirements. The extensive design options ensure that your visuals are not only informative but also visually appealing.
Integration with Other Tools: Infogram integrates seamlessly with other tools and platforms, such as social media, websites, and blogs. This integration makes it easy to share your visual content with a wider audience.
Embedding and Sharing: The ability to embed and share your visual content effortlessly makes Infogram a versatile choice for data presentation. You can embed your charts and infographics in websites, blogs, or social media posts with just a few clicks.
Use Cases and Applications
Marketing: Marketers can leverage Infogram to create compelling infographics and reports that capture the audience’s attention. Infogram’s templates make it easy to create visually engaging content that can boost engagement and conversions.
Education: Educators can use Infogram to develop interactive lessons that make learning more engaging. By incorporating visual aids and interactive elements, teachers can enhance students’ understanding and retention of complex concepts.
Journalism: Journalists can tell stories with data in an impactful way. Infogram helps in creating data-driven stories that are not only informative but also engaging, making complex information accessible to a broader audience.
Business: Businesses can use Infogram for presentations and to drive data-driven decisions. Visualizing data in charts and graphs can help in identifying trends, making informed decisions, and presenting findings in a clear and compelling manner.
Visualize your Data
How to Get Started with Infogram
Step-by-Step Guide:
- Sign Up: Start by signing up for an Infogram account. You can opt for a free plan to explore basic features or choose a paid plan for advanced functionalities.
- Choose a Template: Browse through Infogram’s wide range of templates and select one that suits your needs. Whether it’s a business report, educational infographic, or social media post, there’s a template for every purpose.
- Import Data: Import your data from CSV files, Excel spreadsheets, or Google Sheets. Infogram’s data import feature ensures that you can easily integrate your existing data into your visual content.
- Customize Your Visual: Use Infogram’s customization tools to modify colors, fonts, and layouts. Tailor your visual content to match your brand or project requirements.
- Share and Embed: Once you’re satisfied with your design, share it directly on social media, embed it on your website, or download it for offline use. Infogram makes it easy to distribute your visual content to a wider audience.
Pros and Cons
Pros:
- Intuitive interface.
- Wide range of templates.
- Real-time collaboration.
- Integration with multiple data sources.
Cons:
- Some advanced features are behind a paywall.
- Limited offline capabilities.
Pricing Plans
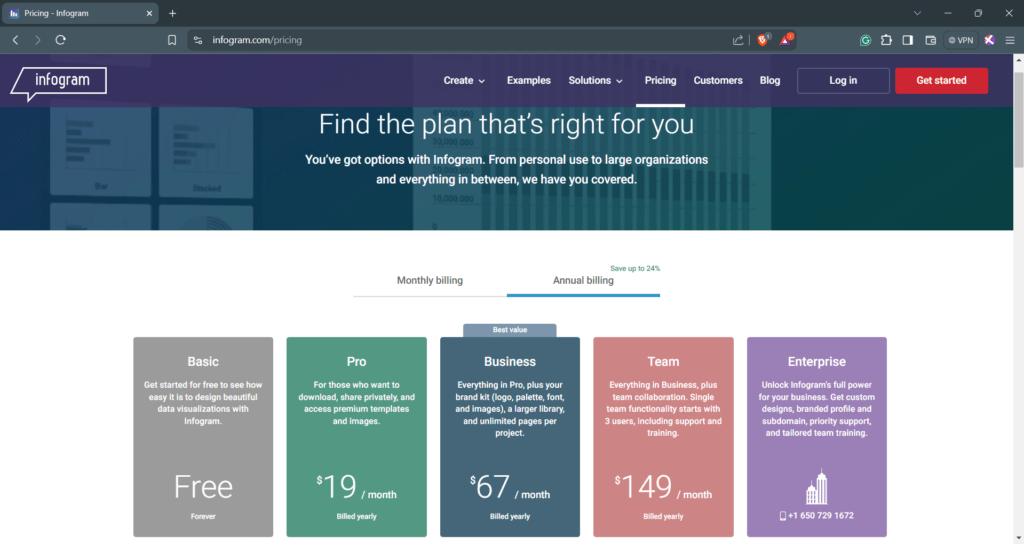
Infogram offers a variety of plans to suit different needs. The free plan includes basic features, while paid plans unlock advanced functionalities like premium templates, additional data sources, and enhanced customization options. Depending on your requirements, there’s a plan that will fit your budget and needs.
Free Plan: Ideal for beginners and those who need basic features. Includes access to a limited number of templates and basic customization options.
Pro Plan: Perfect for individual professionals and small businesses. Unlocks more templates, advanced customization options, and additional data sources.
Business Plan: Designed for larger teams and organizations. Offers premium templates, extensive customization options, real-time collaboration, and priority support.
Enterprise Plan: Tailored for large enterprises with specific needs. Provides all the features of the Business plan, along with dedicated account management and advanced security options.

Conclusion
Infogram is a powerful and versatile tool for anyone needing to present data visually. Its intuitive design, extensive features, and collaborative capabilities make it a standout choice for data visualization. If you haven’t tried it yet, give Infogram a shot and see how it can transform your data presentation needs. By mastering Infogram, you’ll be able to turn raw data into compelling visual stories that capture attention and drive engagement.

